The GE-McKinsey Matrix: a business portfolio analysis and strategic decision-making tool
Published on February 14, 2025
The GE-McKinsey Matrix: a business portfolio analysis and strategic decision-making tool

The GE-McKinsey Matrix, or attractiveness/strength matrix, is a strategic decision-making tool that facilitates the management of a portfolio of activities within a company. This model makes it possible to analyze each of its strategic business units (SBUs) along two dimensions: their competitive strengths and market attractiveness. The position obtained by a business unit on the matrix gives rise to specific strategic recommendations and facilitates the allocation of resources.
Developed in the 1970s by the McKinsey consulting firm, the attractiveness/strength matrix is a decision-making assistance tool. Completed as a team, this modeling makes it possible to analyze the company’s portfolio of activities and formulate recommendations adapted to each strategic business unit.
A strategic business unit, or SBU, refers to a homogeneous segmentation of the company according to its different activities and the markets in which it operates. An SBU is understood to be able to operate as an autonomous entity. The activities grouped together within a single SBU operate in the same markets, face the same competitors, and share similar technologies. A large company generally groups its activities into SBUs to facilitate its organization, decision-making, and resource allocation.
Putting the various activities of your portfolio in a matrix may seem trivial. However, it is a real strategic issue. The reflection carried out during the creation of a GE-McKinsey Matrix is profound; each activity must be evaluated along two lines:
These dimensions are based on a multi-criteria approach, which makes this method a precision tool. In concrete terms, the matrix is composed of nine boxes divided into three zones associated with specific strategies, such as invest and grow, hold and protect, harvest and divest.
The position occupied by the SBU on the matrix leads to the formulation of strategic recommendations to guide the company’s stakeholders in their decision-making. The strategies can be to invest, hold a position, or divest.
The aim is to obtain an overall view of the portfolio’s activities and to increase the effectiveness of the allocation and transfer of financial, human, and material resources. The analysis also highlights promising activities for the future, and those that may threaten the company’s sustainability.

With a few clicks, you can gather your team in Board. This digital whiteboard makes it easy for everyone to share their ideas to foster collaboration, both in the room and remotely, thanks to the built-in video conferencing tool.
By involving people from the company with diverse skills, you benefit from different perspectives and a more holistic view of the company’s business. Your analysis will, therefore, be more accurate by soliciting the collective intelligence of as many people as possible within your team. This is especially true since the choice of analysis criteria and their evaluation are highly subjective.
In addition, to help you with your external and internal diagnoses, you can use three complementary models to the GE-McKinsey Matrix, all of which are available in the Klaxoon library:
And to give each participant time to reflect and optimize team members’ work time, each participant can complete the analysis grid asynchronously. Once this first step has been completed, all you have to do is meet again at the same time to discuss and place your SBUs in the matrix as a team.
This first step is undoubtedly the most complex. First, you need to identify the strategic business units (SBUs) within your company. To do this, you must understand that an SBU is a subset of activities that depend on the same criteria in a specific market. These criteria include key success factors, resources, competition, customers, etc. A concrete example: a fire safety company distributing fire protection systems, maintaining the installed equipment, and providing training in fire prevention would be likely to have identified three SBUs (trading, maintenance, and training).
In the Klaxoon template’s analysis grid, enter your company’s strategic business units in the form of ideas (these are Klaxoon’s colored thumbnails, which you can move around the Board). They have customizable fields that allow you to provide additional information. Here you may find it useful to indicate the market share that the SBU represents.
List the external factors that influence each SBU, limiting this list to the most important criteria (preferably 3 to 7). Then, using the Rating Question, each person judges the attractiveness of the market for each strategic business unit, giving it 1 to 5 stars:
This way, everyone can freely express their own point of view and the overall result is instantly consolidated!

Next, look at the internal factors that play a role in the competitiveness of each SBU. In other words, list the key success factors that need to be mastered in the market to be competitive. Then, everyone gives a heart (with the like button) to the key success factors that the company has mastered. According to the degree of mastery of these key success factors compared to the competition, evaluate the competitive strength of each SBU with the Rating Question:
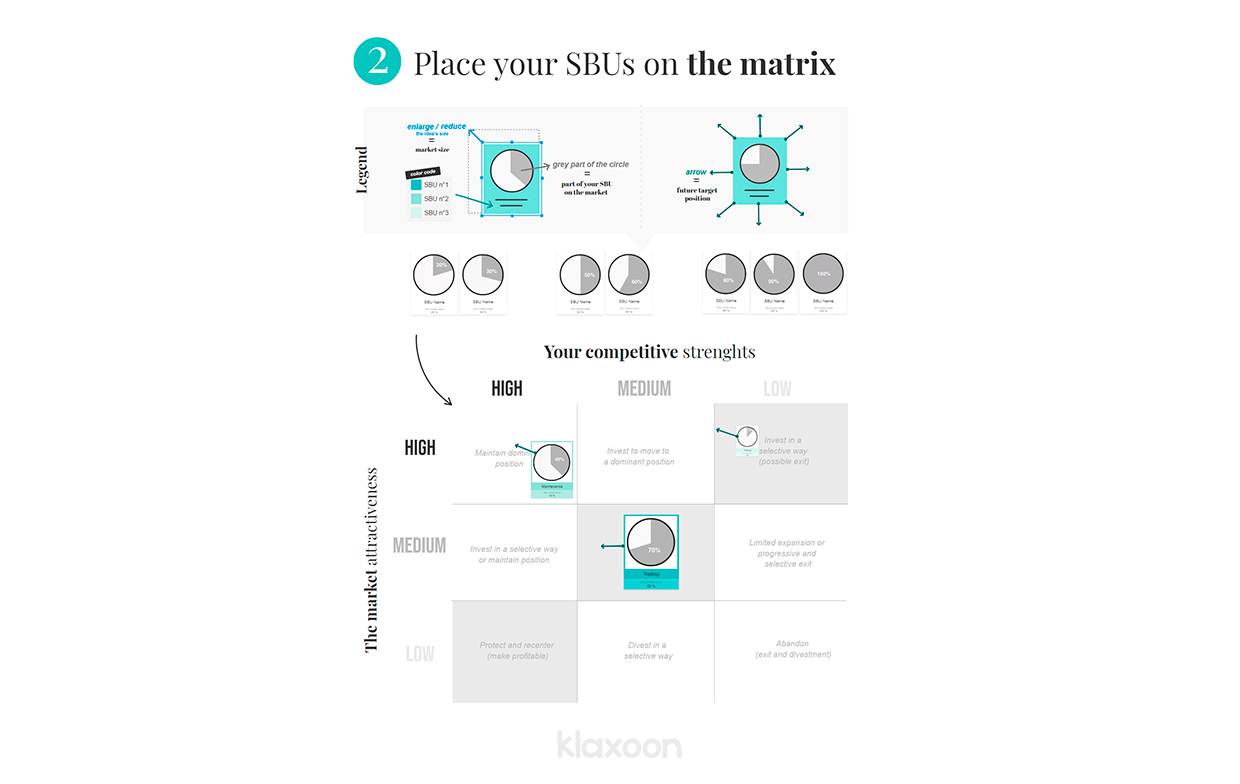
Taking into account the respective market shares of your SBU, select the appropriate pie charts provided in the template to simplify your task. Simply specify the name of the SBU and assign a color to make the matrix easier to read. And to signify the size of the market, just make it bigger or smaller.
Based on the results of your assessment of the external factors, you have determined a low, medium, or high market attractiveness for each SBU. Then, place them in the corresponding area of the matrix, along the market attractiveness axis.
Once this is done, adjust the position of the SBUs along the competitive strengths axis, based on the results of your assessment of the internal factors.
The position of each SBU allows the company’s stakeholders to develop appropriate strategic recommendations. On the matrix, the gray diagonal corresponds to the three strategies for maintaining and making the SBUs profitable.
The three strategies above this diagonal are aimed at strengthening and growing an SBU. Below this diagonal, the situation of an SBU is of little interest. The three strategies there are related to partial harvesting or even divestment.
From your initial goals, set the desired positions for your SBUs taking into account the changing factors. For each strategic business unit, indicate the desired future position with an arrow, and then explain the overall strategy.
Thanks to Board, your analysis is more visual and is a team effort!
Get inspired by other templates from the same categories
Unlock your teamwork potential