Gantt chart template: Efficiently visualize your project management tasks
Published on February 14, 2025
Gantt chart template: Efficiently visualize your project management tasks


The Gantt chart is an essential tool for organizing and monitoring your project management effectively. By clearly visualizing your tasks, their deadlines and dependencies, it gives you a clear overview and makes it easier to coordinate your teams.
Thanks to its visual potential, the Gantt chart method works particularly well with Board, Klaxoon's online whiteboard. This ready-to-use Gantt chart template gives you all the keys to dynamic and efficient project management, anytime, anywhere.
Invented by Henry L. Gantt in the early 20th century, the Gantt chart is a visual tool for representing project tasks in the form of chronological bars.


The Gantt chart is particularly useful if you:
In project management, the Gantt chart can be seen as a roadmap that structures the work to be done by all the stakeholders involved. At each stage, it becomes easier to allocate responsibilities, visualize deadlines, and ensure that everyone remains aligned with the overall objectives.
There are a number of benefits to implementing the Gantt chart method in your project management:
The flexibility of this tool means it can be adapted to all teams, whether on site, remotely, or in hybrid mode.
Klaxoon reinvents the Gantt chart experience with an intuitive and collaborative approach. At every stage of your project, this interactive template on Board harnesses the potential of visual management to help you achieve :
Thanks to this template, your Gantt charts are clearer and more visual, saving you time and avoiding communication errors, even in complex project contexts.
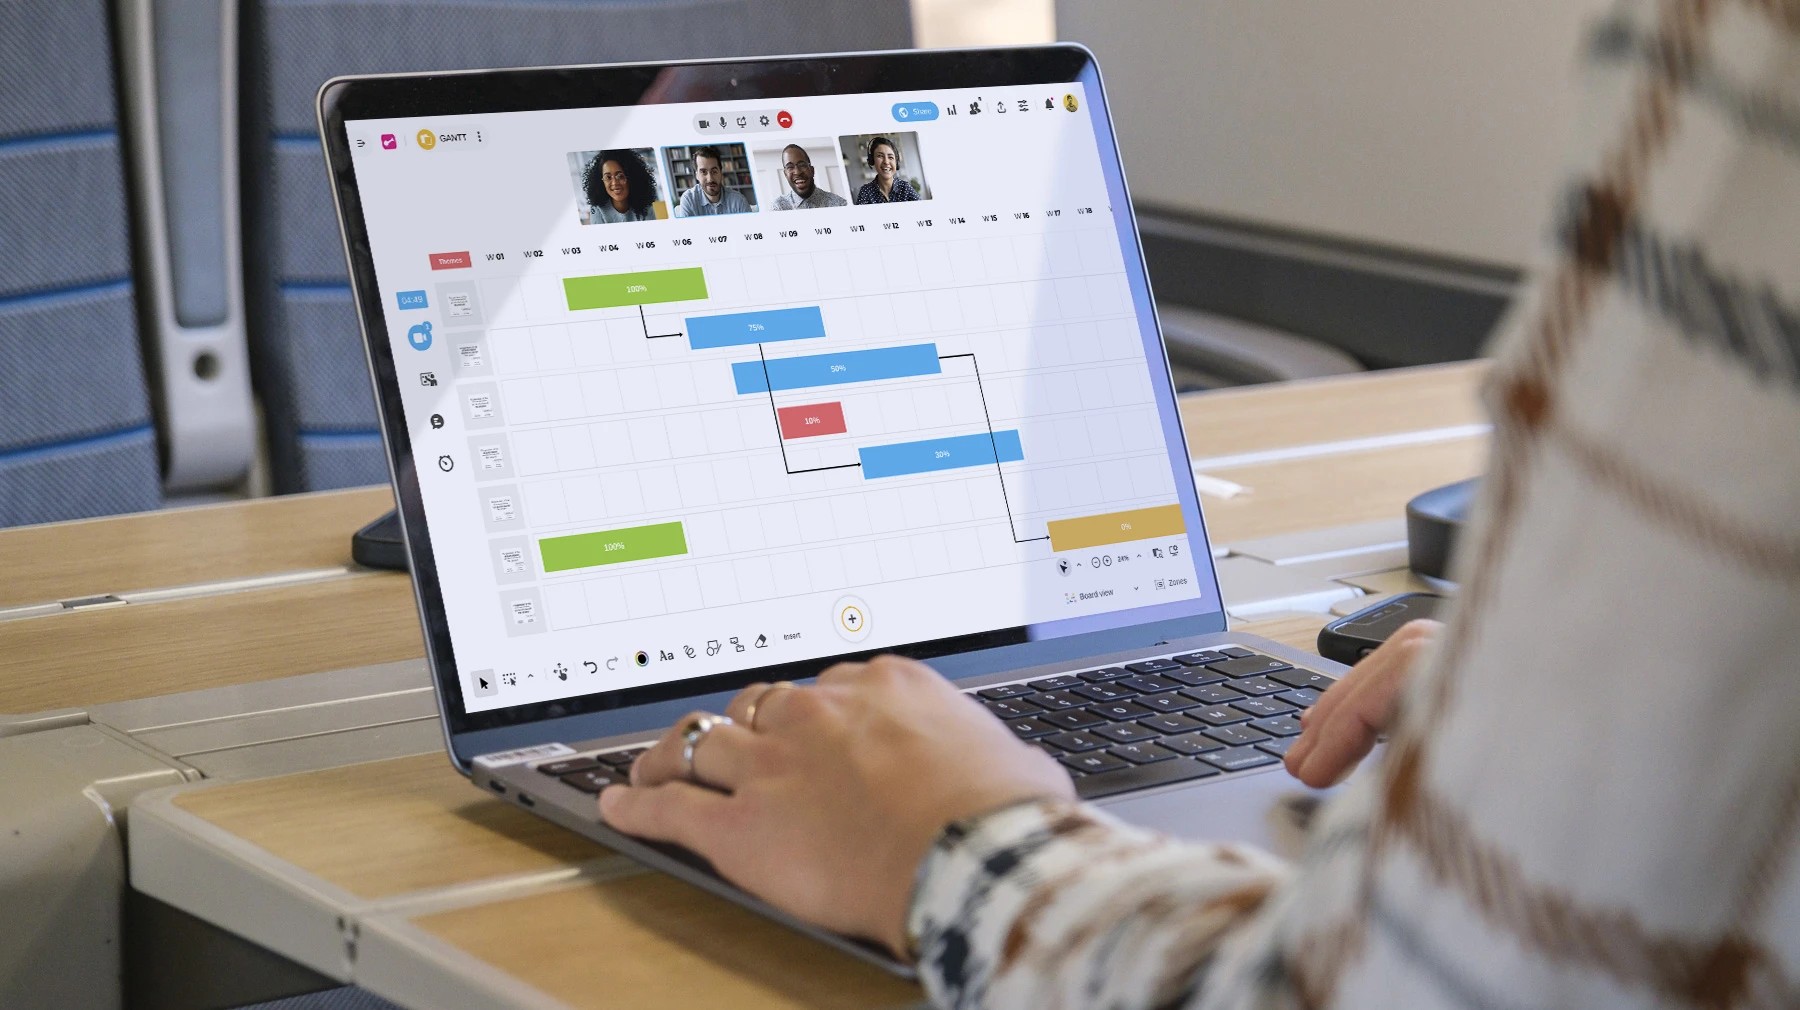
With this Gantt chart template, you can choose to plan your project by week or by month. Each row corresponds to a task identified in your project in the form of an idea, and Board’s features allow you to customize them in multiple ways:
Once you have filled in your task, you can represent it over time on your Gantt chart by extending the rectangle on that row, depending on your needs. For greater clarity, don't hesitate to use color codes to inform your team of the status of each task, or to indicate its percentage of completion in the rectangle.
Finally, if several tasks are correlated, you can easily link them on your Gantt chart using visual connectors on your Board.
The result is an interactive experience that promotes engagement and productivity among your teams. Everyone knows what needs to be done and when, maximizing your efficiency and performance.
Whether you are managing a short project or a long-term initiative, this ready-to-use template adapts to any configuration to help you achieve your objectives effectively.
Get inspired by other templates from the same categories
Unlock your teamwork potential