Template

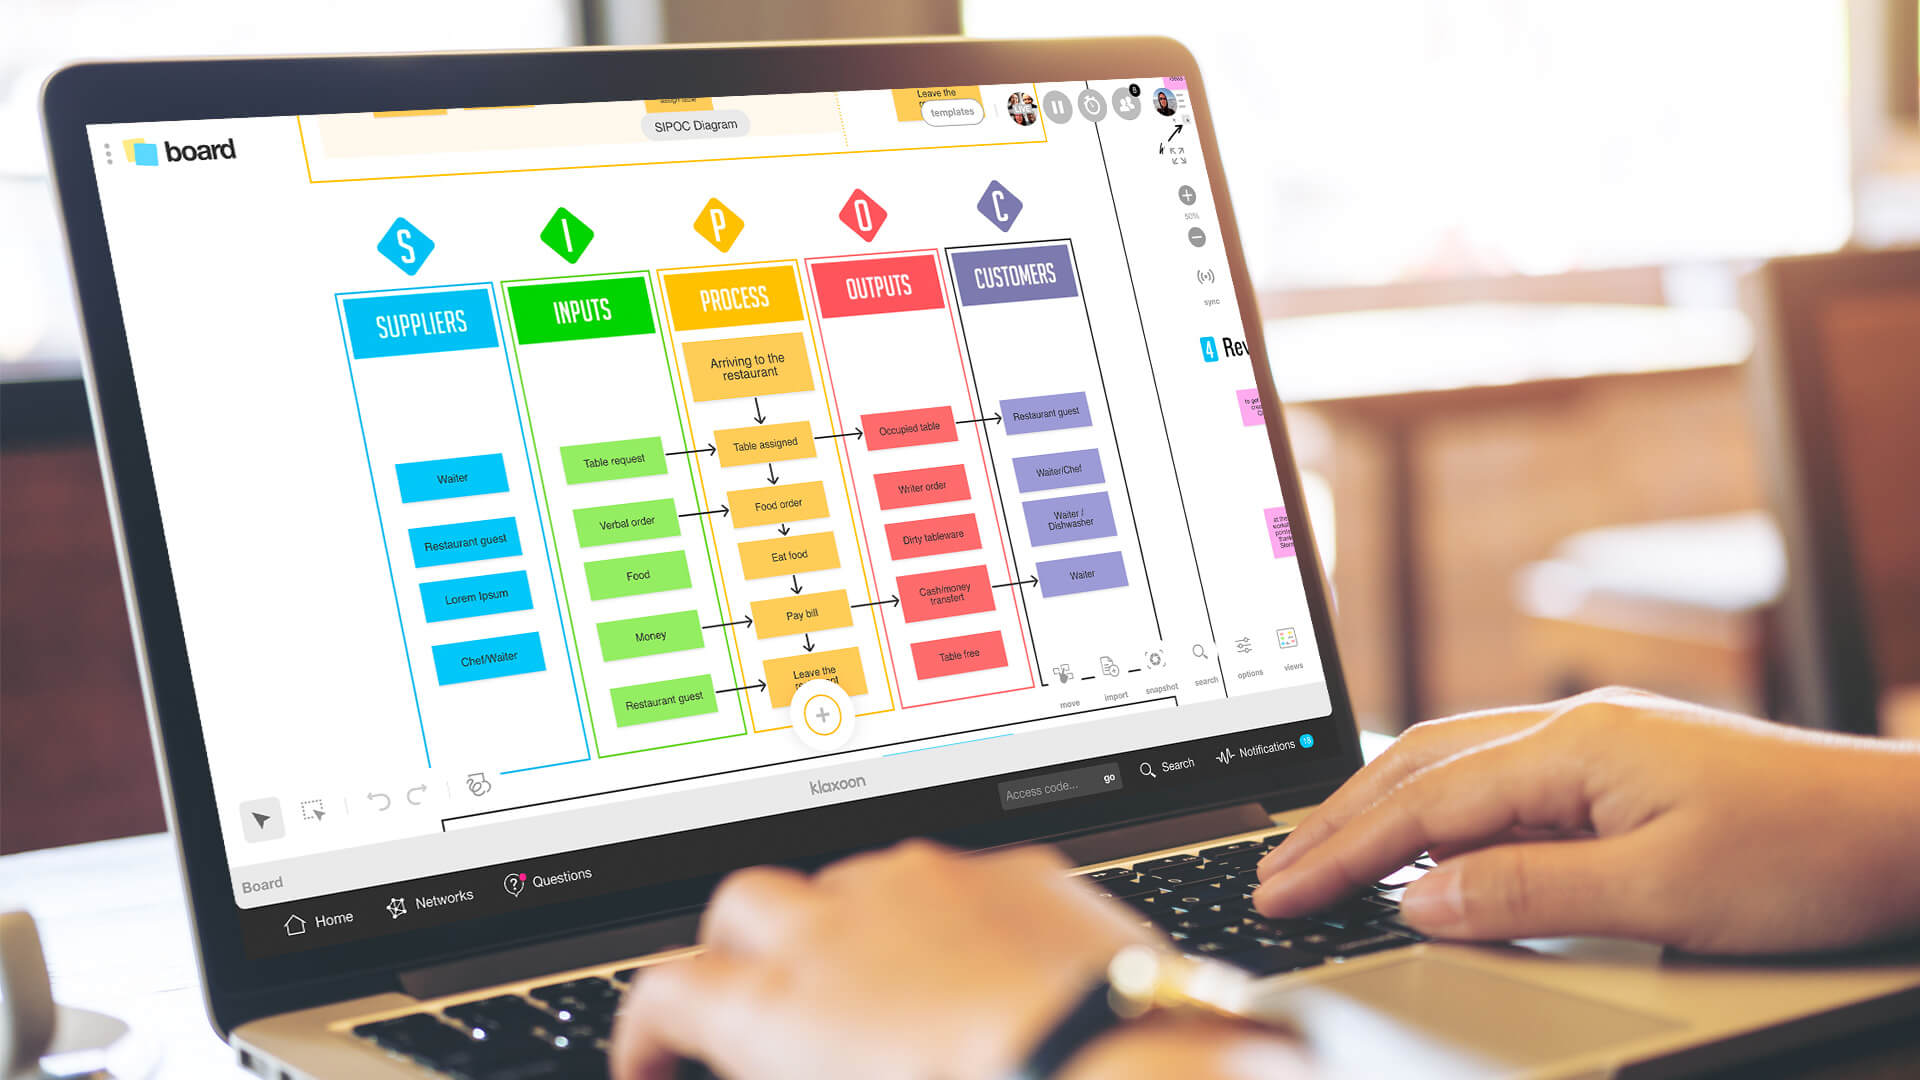
SIPOC Diagram: the process mapping table

PRO

SIPOC Diagram

Level
In-person
Remote
Shared by 

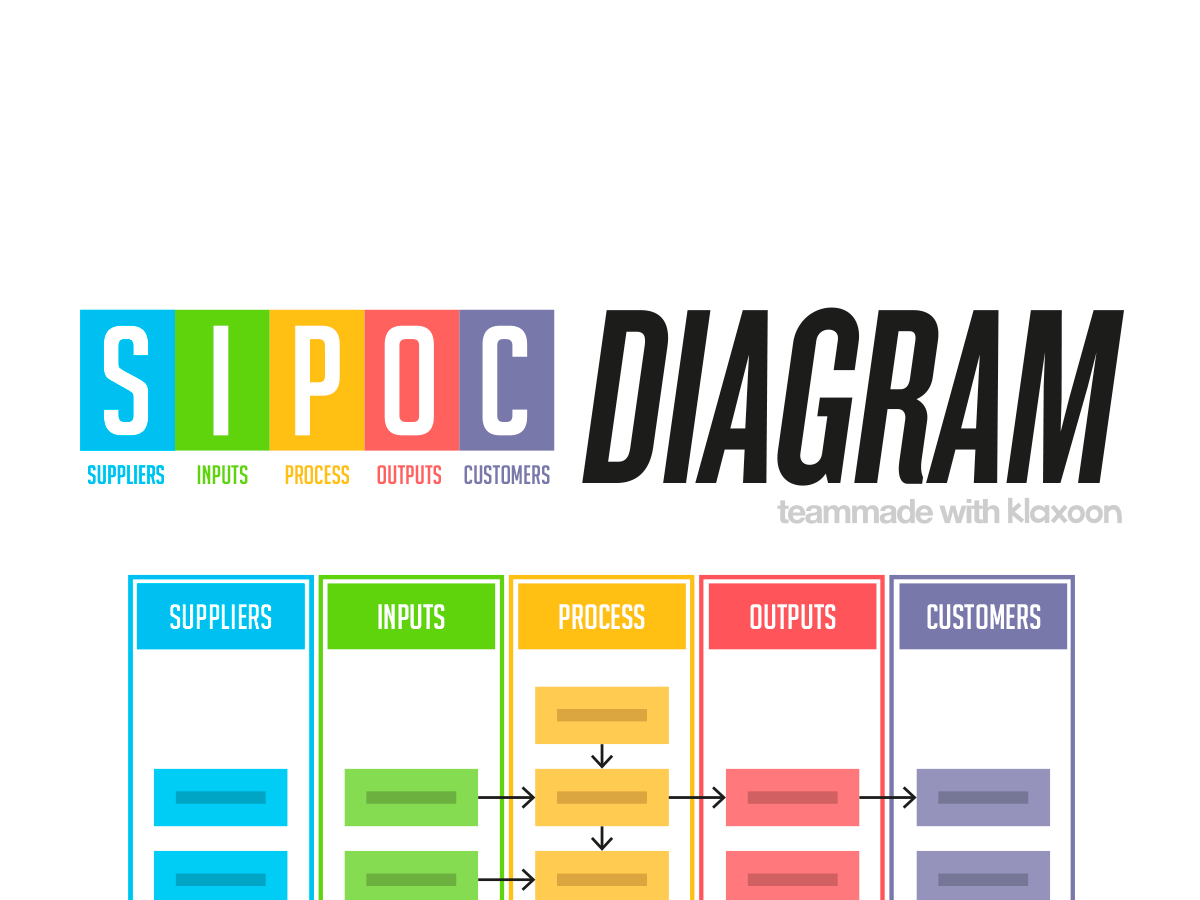
With the SIPOC Diagram template (Suppliers, Inputs, Process, Outputs, Customers), work as a team to analyze the suppliers, inputs, outputs and customers at each stage of a process. This mapping provides a process analysis to help improve your project management. A visual and collaborative strategic analysis!

Visualize your process characteristics and players with a SIPOC diagram

Are you looking for the ideal method for the process analysis phase? With the SIPOC Diagram template, you can work as a team to detail each step of the process by examining your suppliers, inputs, outputs and customers. This way, you get a clear overall vision through a comprehensive map.

SIPOC is one of the tools originally related to Lean 6 Sigma, a method pioneered by Motorola aimed at reducing process variability and improving overall quality, but it is now widespread in project management of all kinds.

This technique follows a "Supplier-Input-Process-Output-Customer" sequence, used to verify that the process inputs correspond to the outputs of previous processes, and that the process outputs correspond to the inputs expected from subsequent processes. Whether your team is at the beginning or end of the project, meeting in person or with some members working remotely, you can use SIPOC to analyze what is currently at risk, or document a situation at a given moment.

With a color code, get a clear and comprehensive overview of your process efficiently.

How does the SIPOC Diagram template help you analyze and improve your processes?

Business process modeling can be a real challenge. Gathering the necessary information, understanding the process inputs and outputs, its beginning and end, the sequence of tasks, the managers for each of them, defining customers etc. can be very complex and laborious. And all the time, you have to work as a team to train people, have meetings, discuss and share your ideas. With the practical and intuitive SIPOC method, you can do this with the greatest of ease!

It enables you to map processes and better understand the value chain of processes documented this way. Its visual aspect makes it extremely effective, especially when combined with the graphic features of Board, Klaxoon's whiteboard.

SIPOC is a relatively simple-to-use and easy-to-understand tool, because it lets you visualize the entire model at a glance. So you can share your information not just with your team, but also potentially with your users, which will improve your project management in the long run.

Using a SIPOC diagram will help you understand the process characteristics and how it works before you embark on improving your project management. It is also ideal for analyzing why it doesn't work, defining the project scope and its players, or describing a current situation in relation to a future one.

Creating a SIPOC diagram with the Klaxoon template

Start by inviting your team members and other stakeholders to your whiteboard. Enter the date and name of the project, along with the name of the process to be analyzed and its version if applicable.

Ask participants to send their ideas for process actions to the “Process” section of the table, and then select the most appropriate ones together, by voting with the heart symbolizing a “like”. Next, discuss these actions as a team to organize them in the “OK” column. You can put non-used ideas in “Off-Topic”, and time this phase using the stopwatch.

Copy and paste each step of the process into the “Process” column in the SIPOC table. For each one, identify suppliers, inputs, outputs and customers using the colors in the legend. To help you, you can ask yourself the following questions:

  • Suppliers: who provides the material or inputs?
  • Inputs: what resources are required or delivered by the supplier? This can be material or information.
  • Outputs: which product or service is created by the process, or is the result of it?
  • Customers: who are the customers or receivers, the beneficiaries of the process outputs?

Now, all you have to do is organize the ideas to make a visual and easy to understand map quickly. Choose from the alignment and arrow style options, and don't forget the direction of the connectors! You can show or hide the color code. It's up to you.

End your workshop with a, small retrospective, by creating a poll Question to ask participants their opinion about this SIPOC workshop. If you want to identify areas for improvement, you could create a Live Storm Question too. All the participants must do is double-click on the ideas to respond, as the results are consolidated and displayed automatically.

Unlock your teamwork potential

For free, make your first steps to top-tier work efficiency with the Klaxoon Visual Platform.
Start for free